Results and post-processing
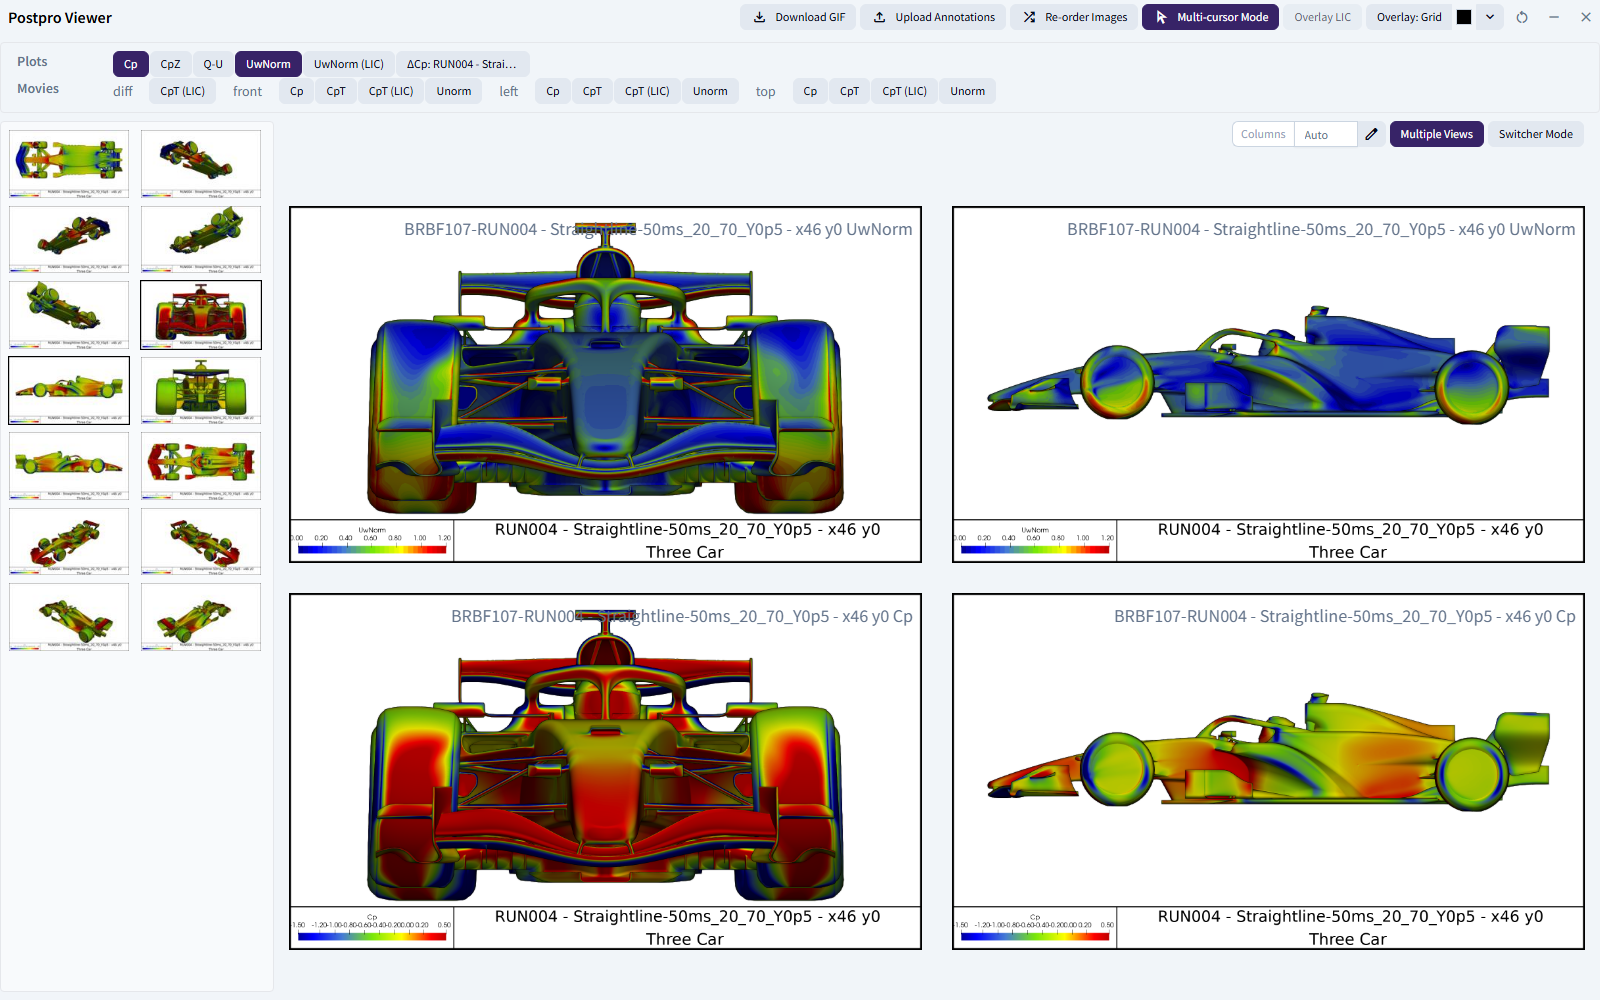
After a simulation is solved, Bramble post-processes it automatically. "Postpro" means both that stage and the images and movies it produces.
- Forces and coefficients. Bramble calculates the aerodynamic forces and moments on every zone of the model and converts them into non-dimensional coefficients.
- Plots. Static images of the model's surfaces (for example the car or cyclist), coloured by flow variables. They are rendered from a number of camera angles (14 views by default), and you can customise the angles for each Run.
- Movies. An animated slice moving through the flow field, showing how the flow develops around the model. There are three views by default: front, side and top.
- Deltas. If the Run has a baseline, Bramble also produces delta plots and movies from every view, and delta values for every force. They show what changed from the baseline, and by how much.
The Results table
A configurable table showing the forces and parameters of every Run and Attitude in the current Project.
The Results page collects the calculated values from each simulation into a table. Each simulation produces a large number of values, and table views control which of them you see and how.
Configure columns. Choose which values to show, and reorder and rename columns. Set the rounding for each column (decimal places or significant figures), or have Bramble colour cells based on their value.
Inline deltas. Deltas against a Run's own baseline appear automatically. You can also compare the table against another Run or Attitude for the time being, without changing any Run's baseline. See compare against a baseline.
Custom calculations. Write equations that derive new values from the calculated forces.
Text columns. Add text columns for comments or summaries that sit alongside the results.
Combine data from anywhere in the Account. A Sandbox collects results from any Programme or Project into a single table. That lets you tell a development story, whatever structure you've chosen for your data.
Export. Download the results as customised CSV files, and download the generated images and movies.
The postpro viewer
Bramble's viewer for the generated plots and movies. Open it by selecting Attitudes in the Results table.
Side-by-side comparison. Select several variables, views and Attitudes and view them together in a custom grid. Or use the switcher to toggle instantly between images, which makes small differences easy to spot.
Overlays. Add custom grid overlays, or overlay one plot on another, to help compare results.
Image deltas on the fly. Generate a delta image between any two images in seconds, without reprocessing either simulation.
GIFs. Create animated GIFs from the selected images.
Annotated images. Draw, add shapes and write on an image, then upload it to Bramble to sit alongside the generated postpro. The image can be postpro, a screen grab or an external picture, so you can add context to your results.
Graphs
From the Results page you can generate these graphs for the selected Attitudes, where the data supports them:
- custom line, scatter, bar and parallel-coordinate graphs of any values in your simulations
- force convergence
- force distribution
- centre of pressure, including the resultant force vector and its line of action
- microphone data from acoustic solves (using the integrated zCFD methodology)
- wake plots, if the simulations have wake planes configured